Quicken displays the reports and graphs you create in the Reports & Graphs window, which, along with the report and graph data, includes menus and buttons for saving, customizing, and printing reports and graphs.
While the reports and graphs you create in the Reports & Graphs window can bring together account information from many areas of Quicken, sometimes what you really want is just the information about a specific account or item in an account (such as a category or payee). Because of this, you can also create a number of reports right from your register.
For example, you can create a one-click minireport to give you instant insight into your spending by category or payee for one of six time periods. If you'd prefer category or payee information for a different time period, or if you want a full category or payee report that you can customize in a number of other ways, you can also create register reports.
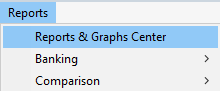
- Choose Reports menu > Reports & Graphs Center.
- In the Quicken Standard Reports list on the left, select the arrow next to the section you want to expand reports for, such as Banking.
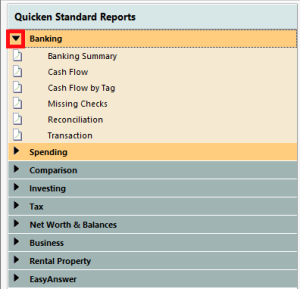
- Select the report or graph you want, such as Cash Flow.
Select the date or dates you want the report or graph to include. If the date range you want isn't in the default list, you can select Custom dates and specify your own.
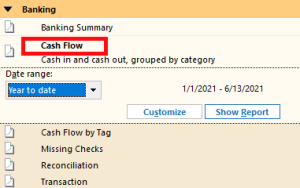
- Click Customize to customize the report or graph. (Optional)
- To display the report, click Show Report or Show Graph.Quicken searches the current file for transactions within the date range and then displays the report when the search is complete. The search may take several seconds, depending on how much Quicken data you have.
To display the same data in the other format, click the Show Report or Show Graph button. To hide a format, click the corresponding Hide button. (Optional)
Why don't I see a Show Graph button?
The Show Graph button appears only when a graph option is available. Not all reports can be displayed as graphs.
- Select Save Report to save the report or graph. (Optional)
Once you have customized the report you can do the following:
Notes
- Use the Back and Forward buttons in the upper-left corner of the report to navigate through a report's history.
- You can create a number of banking, spending, and tax reports in Quicken. If you own Quicken Premier, you can also report on your investments. If you own Quicken Home & Business, you can also report on your business.
Overview
Content Tools